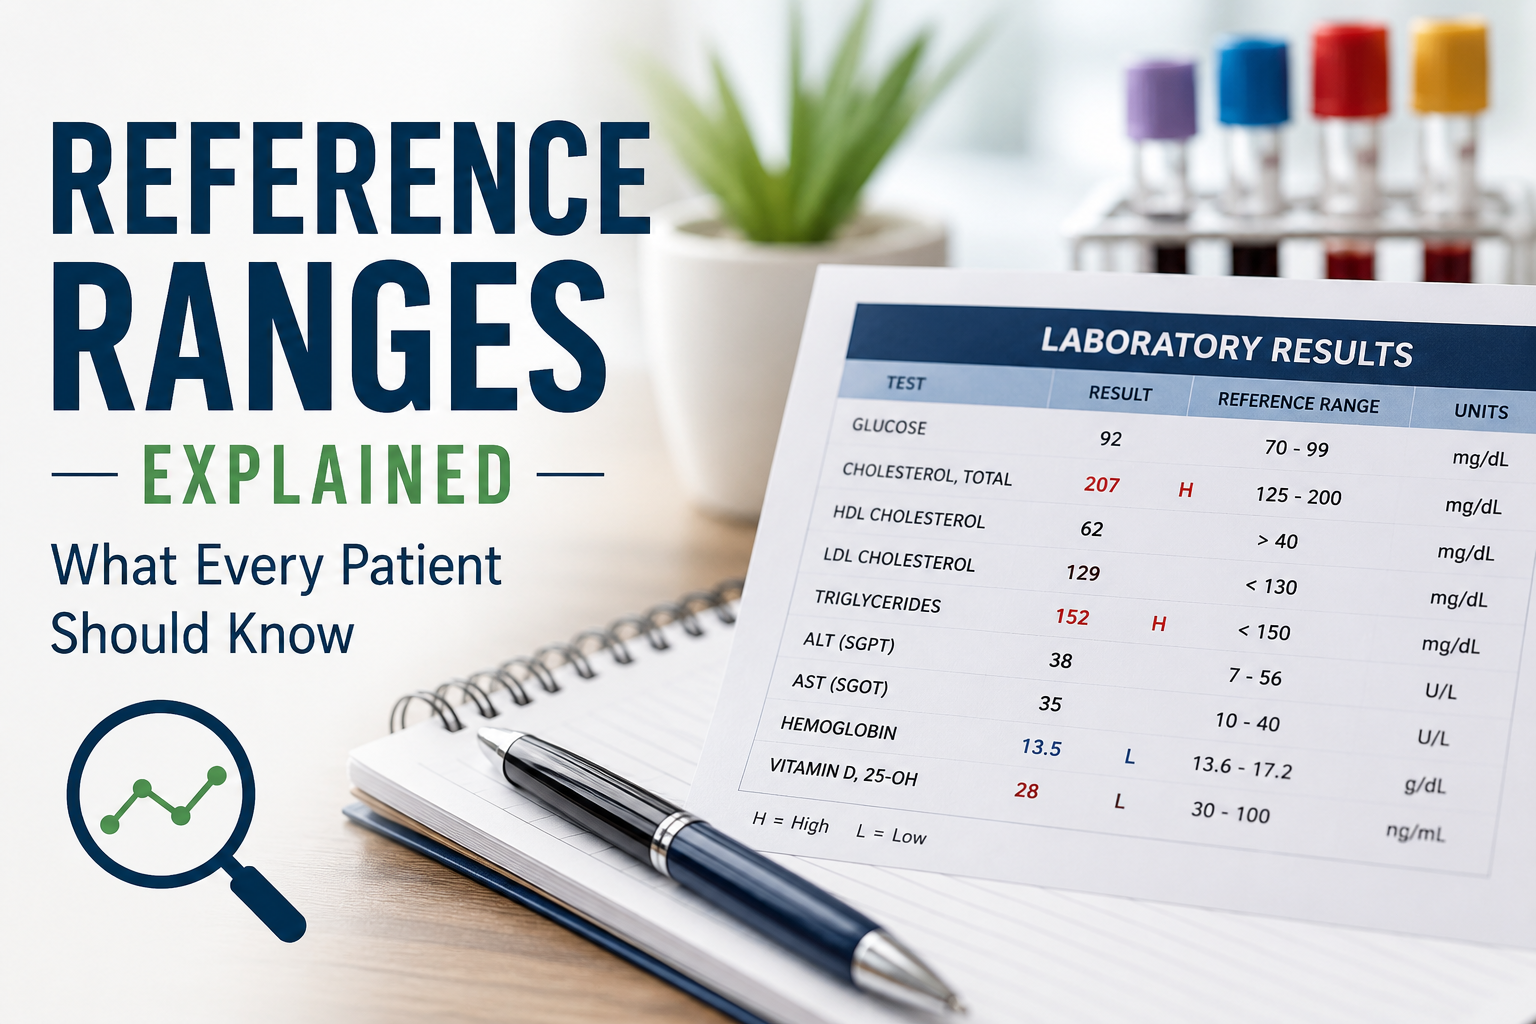
Reference Ranges Explained: What Every Patient Should Know
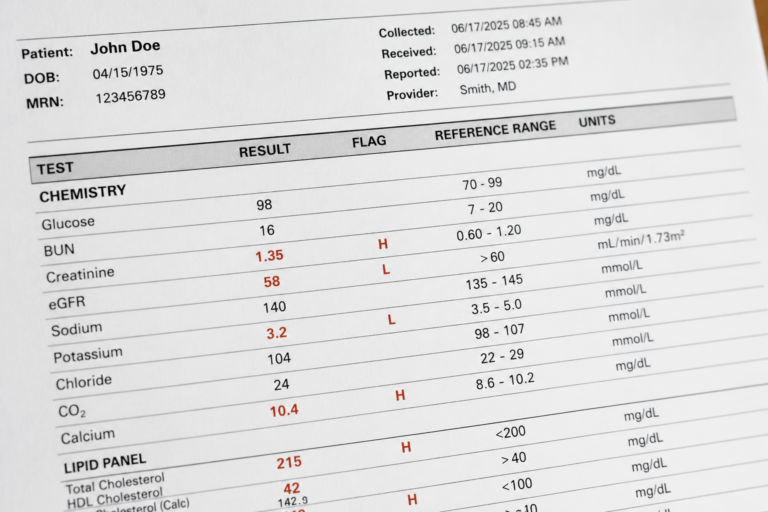
You open your patient portal and see a list of numbers. Some are highlighted in red. Others say “High” or “Low.” Your first reaction might be relief, confusion, or panic.
Maybe you feel awful, but every number says “normal.” Or maybe one value is flagged, and suddenly you can’t stop thinking about it. Either way, you’re left staring at a report that’s supposed to explain your health — and it doesn’t feel like it’s explaining much at all.
Here’s the part no one tells you at your appointment: that “normal” range on your report isn’t a pass-or-fail line. It’s a general guide built from other people’s bodies, not a verdict on yours. A result outside the range isn’t automatically a problem, and a result inside the range doesn’t automatically mean everything is fine.
Once you understand what a reference range actually is — and isn’t — those red flags and “normal” labels stop feeling like a mystery. You’ll know what’s worth asking about, what’s probably nothing, and how to talk to your provider about the numbers that don’t add up with how you actually feel.
What Is a Reference Range?
A reference range is the set of “typical” results for a lab test. Labs build these ranges by testing a large group of healthy people and looking at where most of their results fall.
Usually, a reference range covers about 95% of that healthy group. That means:
- A result outside the range isn’t automatically dangerous.
- A result inside the range doesn’t automatically mean you’re in the clear.
A simple way to picture it: Think of a clothing size chart. Most people fit somewhere within the common sizes. But plenty of healthy people fall just outside those sizes too — that doesn’t mean something is wrong with them. It just means they’re a little different from the average.
How Are Reference Ranges Created?
Labs create reference ranges by testing groups of healthy volunteers and running statistics on the results. Several things affect where the range lands, including:
- Age
- Sex
- Sometimes ethnicity or pregnancy status
- The equipment used to run the test
- The lab that processes the sample
Because of this, it’s common for two different labs to report slightly different reference ranges for the exact same test. If you switch labs or hospitals, don’t be surprised if the “normal” range on your report changes a little.
Why Your “Normal” May Not Match Someone Else’s
Everyone has a personal baseline — the level that’s normal for them — and it can sit anywhere inside (or even outside) the standard reference range. Things that shape your personal baseline include:
- Genetics
- Chronic health conditions
- Medications
- Athletic training
- Age
Example: Someone whose hemoglobin usually runs around 16 may feel tired, dizzy, or “off” at a hemoglobin of 13 — even though 13 still falls inside the lab’s official reference range. For that person, 13 is low, even if the report doesn’t flag it.
This is why comparing your results to your own history often matters more than comparing them to the general range.
When a Result Outside the Range May Not Be Serious
Plenty of things can nudge a single result above or below the reference range without pointing to a real problem, such as:
- Slightly elevated cholesterol
- Mildly low sodium
- One liver enzyme that’s just barely high
- A temporary illness or infection
- Dehydration
- Recent exercise
- Stress
- Time of day the blood was drawn
Context matters. A single flagged number, on its own, rarely tells your provider the full picture.
When “Normal” Doesn’t Always Mean Healthy
Here’s a concept that surprises a lot of patients: it’s possible to feel unwell and still have “normal” lab results. This can happen when:
- Your symptoms continue even though the labs look fine
- Your values are trending in a concerning direction, even while still “in range”
- A disease is in its early stages, before it shows up clearly on a test
- Your body’s normal variation just doesn’t match the general population
This is exactly why good medical care doesn’t rely on lab numbers alone. It combines your history, a physical exam, your symptoms, imaging, and lab work together. No single number tells the whole story — and you shouldn’t have to fight to be heard just because your labs came back “normal.”
Why Trends Matter More Than One Number
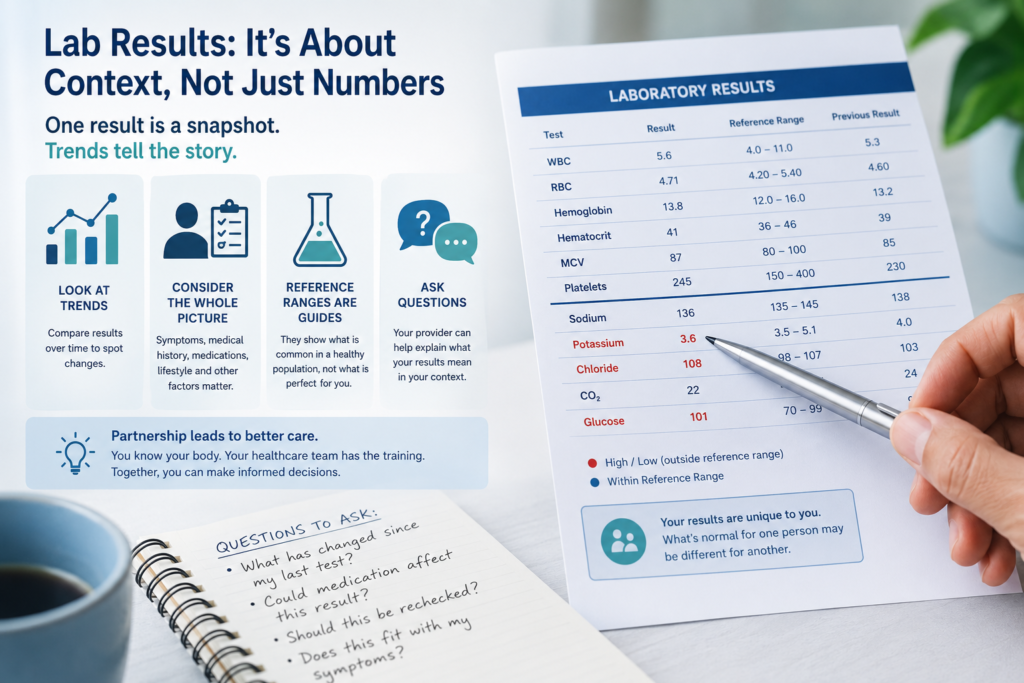
One lab result is a snapshot. A series of lab results over time is a story — and that story is often far more useful.
Looking back at previous lab reports can help you and your provider spot:
- Gradual changes that a single test would miss
- Values that are slowly rising or falling
- Patterns worth watching in chronic conditions
This is one of the best reasons to keep copies of your important lab work. A number that looks unremarkable today might matter a lot more when you can compare it to where you were six months or a year ago.
Reference Ranges vs. Your Personal Trend: A Quick Comparison
| Standard Reference Range | Your Personal Trend | |
|---|---|---|
| What it shows | Where most healthy people fall | Where you typically fall |
| Based on | A large studied population | Your own past results |
| Best used for | A general starting point | Spotting real changes over time |
| Limitation | Doesn’t account for your baseline | Needs past results to compare against |
Questions to Ask About Your Lab Results
Next time you review a lab report with your provider, these questions can help you get a fuller picture:
- Is this result significantly different from my previous tests?
- Is this change expected?
- Could any of my medications affect this value?
- Should this test be repeated to confirm it?
- Does this result fit with how I’m actually feeling?
- Are there other tests that could help explain this result?
How to Read Your Lab Report More Confidently
- Look at the units, not just the number.
- Check the reference range listed on that specific report.
- Compare it to your previous results, if you have them.
- Read any physician notes attached to the report.
- Don’t fixate on one highlighted number.
- Step back and consider the complete picture.
The Bottom Line
Reference ranges are valuable guides, but they’re only one piece of understanding your health. A single red flag on a lab report isn’t a diagnosis, and a page full of “normal” results doesn’t mean your symptoms aren’t real.
Use your lab reports as a starting point for informed conversations with your healthcare team — not as a reason to panic, and not as a reason to dismiss how you’re feeling.
Frequently Asked Questions
What is a reference range on a blood test?
It’s the range of results found in most healthy people for that test, usually covering about 95% of a healthy population studied by the lab.
Why do different labs have different normal ranges?
Reference ranges can shift based on the population studied, the equipment used, and the specific lab running the test — so two labs can report slightly different ranges for the same test.
Can you be sick even if your lab results are normal?
Yes. Symptoms can appear before a disease shows up clearly on a lab test, and some conditions don’t reliably change the values these tests measure.
Should I worry if one lab result is slightly high?
Not necessarily. Things like dehydration, stress, recent exercise, or the time of day can all cause a temporary, harmless shift in a single result.
Why are some lab results highlighted in red?
Labs flag any result that falls outside the standard reference range so it’s easy to spot — but a flagged result isn’t automatically a serious problem.
How important are trends in lab results?
Very. A gradual rise or fall across several tests often reveals more about your health than any single number on its own.