What Is a “Normal” Lab Range, and Why It Matters
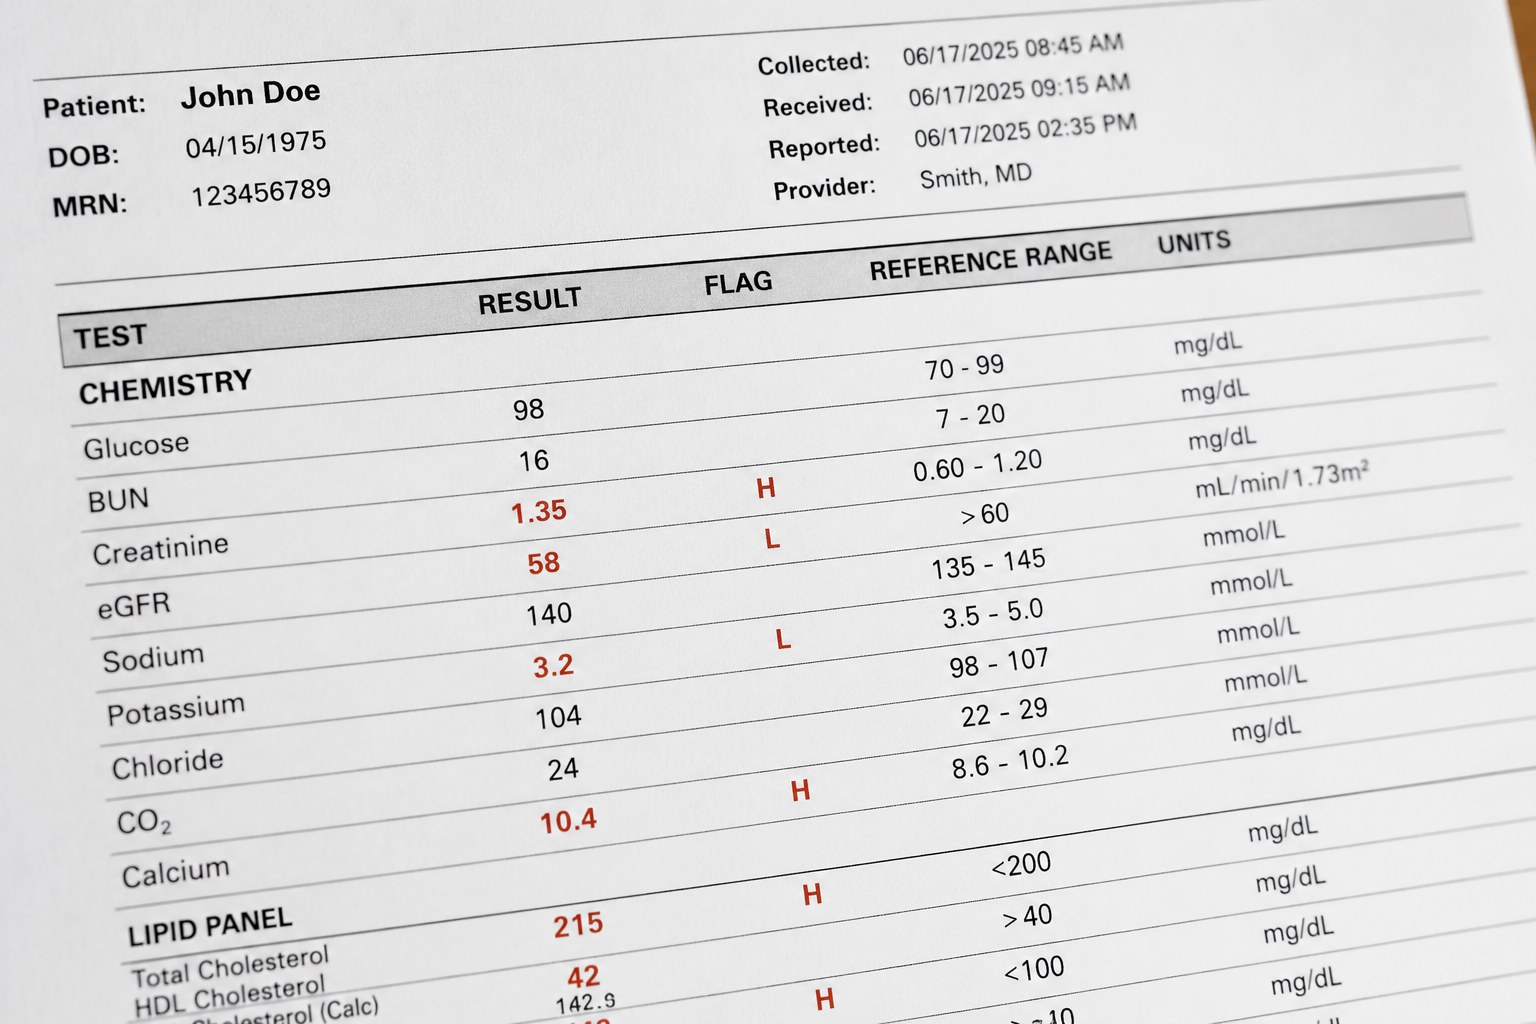
You just got your lab results. One number has a little “H” next to it. Your stomach drops. Is this bad? Should you panic?
Take a breath. That “normal range” printed next to your result is not as simple as it looks. It’s not a pass or fail test. It’s a tool. And once you understand how it works, you’ll read your own labs with a lot more confidence.
Where the “Normal Range” Actually Comes From
Here’s something most people never get told. A lab doesn’t pull that range out of a medical textbook that applies to everyone on earth. Each lab builds its own range by testing blood from a big group of healthy people, usually at least 120 of them. Then they look at where most of those healthy people landed.
The range you see is built to cover 95 out of every 100 healthy people tested<cite index=”6-1″>. It’s usually defined as the set of values 95 percent of the normal population falls within, and it’s determined by collecting data from vast numbers of lab tests.</cite>
That last part is the key. Ninety-five percent. Not 100 percent.
That Means Something Important: Healthy People Can Fall Outside the Range
If a range only covers 95% of healthy people, that leaves 5% out. That’s 1 in every 20 healthy people who will get a result flagged as “abnormal” even though nothing is wrong with them.
MedlinePlus, a trusted health resource from the National Library of Medicine, puts it plainly. <cite index=”10-1″>A result that is higher or lower than your reference range may or may not be a sign of a health problem, and it’s common for healthy people to sometimes have results outside that range.</cite>
So one flagged number is not a diagnosis. It’s a nudge to look closer, not a verdict.
The Range Can Be Different at Every Lab

Here’s another thing that trips people up. You get bloodwork done at one lab, then later at a different lab, and the “normal” range printed on the page is different. You didn’t do anything wrong. The labs did.
Testing.com explains that <cite index=”18-1″>results are meaningful only when compared to reference values, and you must use the range from the specific lab that ran your test, since equipment, chemicals, and methods can vary from lab to lab.</cite> That’s also why comparing your results to a range you found online, instead of the one printed on your own report, can be misleading.
If you’re tracking something over time, like cholesterol or thyroid levels, try to use the same lab each time. It makes your trend line actually mean something.
A Normal Result Isn’t a Guarantee Either
This one surprises people. Falling inside the range doesn’t automatically mean you’re in the clear. Testing.com notes that for many tests, results from healthy people and results from people with real health problems overlap quite a bit. So a “normal” result is reassuring, but it isn’t a promise.
This is exactly why your provider looks at your labs alongside your symptoms, your history, and how you’re feeling. The number is one piece of the puzzle. It was never meant to be the whole picture.
Age, Sex, and Even the Time of Day Can Shift the Range
Reference ranges also account for real differences between people. A range for a child may not match a range for an adult. A range for men may not match a range for women. Some labs even adjust for the time of day a sample was drawn or whether you’d eaten beforehand.
That’s part of why two people can look at the exact same number on paper and have completely different takeaways from their doctor.
So What Should You Actually Do With a Flagged Result?
Here’s the simple version.
- Check the range printed on your own report, not one you found on Google.
- Notice how far outside the range your number is. A little outside is very different from a lot outside.
- Bring it to your provider with any symptoms you’re having. Context is everything.
- Don’t panic over one flagged value, and don’t dismiss a pattern of flagged values either.
Your lab report is information. It’s not a verdict, and it’s not something to fear. Understanding how these ranges get built is one more way to read your own chart with clear eyes instead of getting rattled every time a number turns red.
Sources:
- MedlinePlus, National Library of Medicine: How to Understand Your Lab Results
- Testing.com: Reference Ranges and What They Mean
- Wikipedia, Reference Ranges for Blood Tests (citing standard clinical laboratory statistical methods)